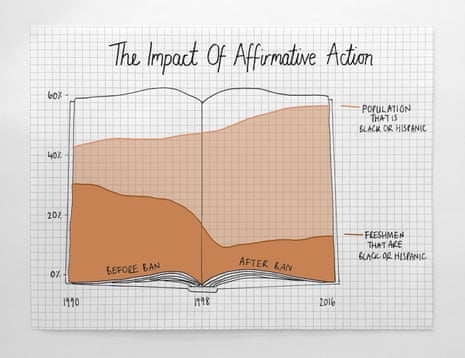
Government documents on Wednesday revealed that the US justice department is planning to investigate and possibly sue universities based on their affirmative action policies.
As president, Donald Trump may be trying to appeal to the 56% of Americans who said they think it’s likely “a white person won’t get a job or promotion while an equally or less qualified black person gets one instead”, according to a General Social Survey (GSS) from the University of Chicago.
A lot of the polling on affirmative action is unsurprising. White Americans are consistently less likely than non-white Americans to support policies that attempt to address discrimination. But the polling is often flawed because it uses biased language in questions. One example (also in the GSS) asked Americans whether they believe blacks should overcome prejudice without “special favors”.
Affirmative action is not a “special favor”. It is a measure aimed at bridging the gap between the best universities in the country that remain largely comprised of whites and the rest of the country that increasingly isn’t.
Several states have banned affirmative action programs in the past. This happened in California in 1998, and when it did, black and Hispanic enrollment at the University of California, Berkeley fell from 24% to just 13%. Now over half of college-age Californians are black or hispanic but only 15% of Berkeley’s freshmen is black or Hispanic.
The graphic above, inspired by one created by The New York Times in 2013, has been updated with more recent data. You can view more details about the numbers here.

.png?width=180&dpr=1&s=none)